

Main content:
1.Research background
With the popularization of electric vehicles and electronic products, battery products have developed rapidly. The huge market potential and the remaining development limitations have stimulated researchers' enthusiasm for batteries. However, most of the researchers who are currently studying batteries are not from the fields of electrochemistry, but from the fields of materials and physical chemistry.
Therefore, they do not necessarily have the knowledge of electrochemical systems for battery technology. Understanding electrochemical data, standard electrochemical tests, and specialized electrochemical analysis are essential electrochemical skills for battery research. To this end, it is necessary to summarize the knowledge of electrochemical testing and electrochemical analysis to provide theoretical support for the majority of battery researchers.
Recently, a doctoral student and a professor (joint communication) from City University of Hong Kong published the latest research work of "Electrochemical Techniques in Battery Research: aTutorial for Nonelectrochemists" on Adv. Energy Mater. This work introduces basic electrochemistry concepts, discusses and analyzes test techniques such as voltage, current, and impedance in detail, and provides a learning outline and tutorial for battery researchers.
3.Research highlights
(1) Introduce the basic electrochemical concepts: voltage, current, capacity and test time. (2) The common evaluation indicators of electrode materials are introduced: energy/power density, coulomb efficiency and cycle life. (3) In view of the above concepts and indicators, common electrochemical test methods are introduced: cyclic voltammetry test, constant current charge-discharge test, AC impedance test, constant voltage intermittent titration method and constant current intermittent titration method, and the above methods are classified into This paper discusses the potential technology, current technology and impedance technology, and discusses the inappropriateness in the current research work and literature reports.
4.Picture and text guide
① Introduction to basic electrochemical concepts
Voltage and Faraday capacity are the essential properties of electrode materials. The voltage is determined by the Gibbs free energy change between reactants and products, while the Faraday capacity is determined by the number of transferable electrons. The specific values can be obtained from equations (1) and (2) is derived, where E is the voltage, ΔrG is the Gibbs free energy change of the reaction, QF is the Faraday capacity, M is the relative molecular mass of the electrode, and F is the Faraday constant.
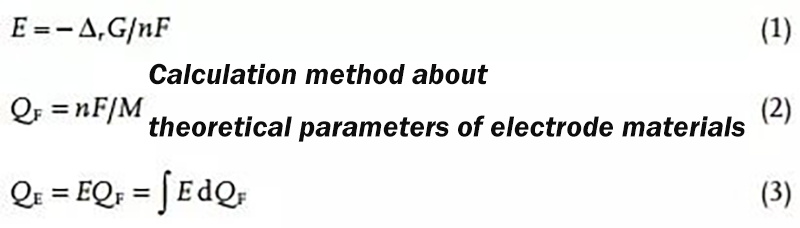
Energy capacity (QE) is the result of voltage and Faraday capacity and can be derived from equation (3). However, the above three equations only point out the calculation method of the theoretical parameters, and the actual experimental results usually deviate from the theoretical calculation results, because the actual situation is usually affected by polarization, side reactions and incomplete reactions. Causes energy to be lost in the form of heat. In addition, Coulombic efficiency and energy efficiency are also important concepts in battery research.
② Potential technology
Cyclic voltammetry (CV) is the most important potential technique in electrochemical testing. The use of cyclic voltammetry in battery research usually involves solid-liquid interfaces, ion diffusion, and multiple reactions. The typical curve obtained by the cyclic voltammetry test is shown in Figure 1(b). A pair of Gaussian peaks corresponds to an electrode reaction. The ratio of the peak current (ip) and its corresponding voltage difference (ΔEp) can be used to judge the electrochemical reaction. reversibility.

Figure 1(a) Voltage curve of cyclic voltammetry test (b) Current response and voltage curve (c) Voltage and integral current curve
When the CV curve is converted into a voltage vs capacity curve (Fig. 1c), the charge-discharge plateau corresponds to the voltage corresponding to the peak current in the CV curve. When current is measured using current density (A g-1) rather than current (A), the absolute value obtained is the specific capacity (mAh g-1). It is particularly important to note that the specific capacity can only be used as a measure when the battery performance is independent of the active material loading.
The cyclic voltammetry test needs to specify a suitable voltage window and scan rate. There are two judgment criteria for specifying the voltage window and scan rate. The first is that the electrode reaction should occur within the specified voltage window range, and the end of The current should drop to zero. The second is that at a specified scan rate, the integrated capacity should be close to the theoretical capacity of the electrode material (based on this, the cell scan rate is generally in the range of 0.1-10 mV s-1).
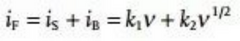
There are three types of electric double layer response (idl), surface response (is) and volume response (iB) in the current response (Figure 2). The response of the electric double layer is similar to that of a physical capacitor, and its size only depends on the capacity and scan rate. Since there is no chemical reaction, it is not a Faraday process. In the battery system, the electric double layer current is usually very small, and the surface response (is) and the volume response (iB) together constitute the Faradaic current, which have different responses to the scan rate. For details, please refer to the following formula:
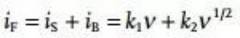
The difference between the surface response and the volume response is that the charge transport in the bulk phase of the solid electrode is much slower than that in the liquid electrolyte. The Faraday process of the surface has capacitive properties and is often referred to as pseudocapacitance or electrochemical capacitance. The biggest difference between electrochemical capacitance and physical capacitance is: (1) The pseudocapacitive current response is related to the voltage, which is determined by the Gibbs free energy change of the surface redox reaction. (2) The chemical reaction process is not instantaneous.
That is, the pseudocapacitive current response is not perfectly proportional to the scan rate. The current contributed by the redox process in the bulk active phase is generated by charge transport and is approximately proportional to the square root of the scan rate. For fully diffusion-controlled electrode reactions, the linear relationship between the peak current and the square root of the scan rate is usually used to calculate the diffusion coefficient.
Reaction kinetics is an important feature of electrode materials, and for this reason, most batteries are designed with pseudocapacitive characteristics and still maintain high-capacity characteristics. Under this concept, nanomaterials are often used as electrode materials to improve rate performance, because nanomaterials inherently have the characteristics of large specific surface area, resulting in high pseudocapacitance contribution and fast diffusion-controlled current response. For purely diffusion-controlled electrochemical systems (mainly cathode materials), CV measurements at different scan rates usually yield diffusion coefficients. However, when the pseudocapacitive contribution cannot be ignored, its contribution value can be obtained by the following equation:

In the above equation, a and b are not constants, but parameters that can vary according to the sweep speed. Under small sweep rate changes, a and b can be treated as constants, the value of b can be derived from the curve of ip vs v1/2, and the value of b is in the range of 0.5-1, corresponding to diffusion control and pseudocapacitive response, respectively. Therefore, it is not difficult to understand that the b value can reflect whether the pseudocapacitive reaction or diffusion control dominates the battery system. But when the b value is in the middle value (such as b=0.8), it cannot be clearly judged that the pseudocapacitive and extended control accounts for compare. To this end, the specific proportion of pseudocapacitive contribution and diffusion control can be quantitatively calculated by the following equation:
However, the disadvantage of this method is that it needs to perform tedious and complex operations, but it can be simplified by matrix operations, such as using MATLAB or other computing programs to automatically run. Another fatal flaw of this method is that this equation is only used when the increased scan rate causes polarization, and thus the resulting peak shift is negligible. To this end, the following equation is proposed to quantitatively distinguish the two-part capacity contribution, which works even when the polarization cannot be ignored.
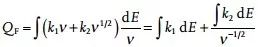
As shown in Figure 2f, a linear curve between the reciprocal of the square root of the scan speed (v-1/2) and the integral capacity can be fitted, and the resulting intercept image represents the pseudocapacitor contribution capacity, which is independent of the scan speed. The slope plot represents the volume of diffusion control contribution, proportional to the square root of the scan rate.
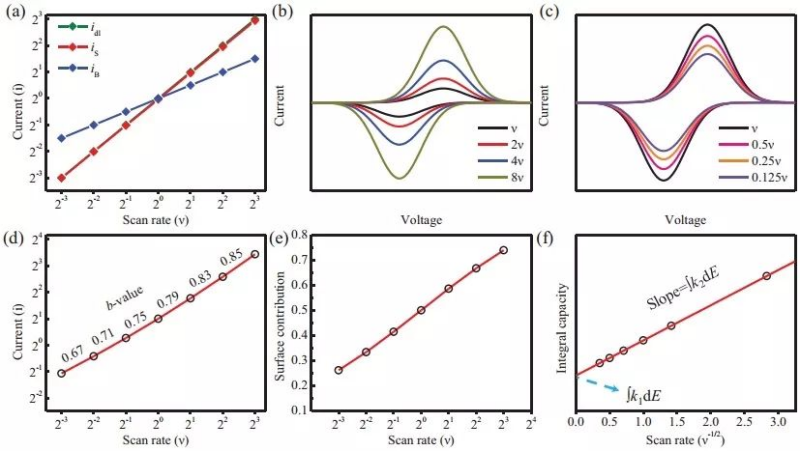
Figure 2 (a) Three current response modes (b), (c) Cyclic voltammetry curves at different scan rates (d) log2(ip) vs log2(v) curve (e) Pseudocapacitance contribution (f) Linear fit of integral capacity vs inverse of square root of scan rate
③ Current technology
The constant current charge-discharge test is a test method commonly used to evaluate battery capacity, reversibility, cycle performance and rate performance. It is tested at a constant current (Fig. 3a) and needs to specify an electrochemical window that is the same as the CV test. There is a sloping curve with a distinct plateau (Fig. 3b). In order to more easily see the potential plateau, an integrated capacity curve (dQ/dV vs V) can be made, which produces a peak corresponding to the plateau of the GCD curve and consistent with the peak of the CV curve. It is worth mentioning that the dQ/dV curve will inevitably generate a lot of burrs during the integration process.
In order to avoid this problem, the GCD curve can be smoothed (remove white noise) in advance, and the interval of the value points can be increased (reducing error by obtaining (Qn+k-Qn)/(Vn+k-Vn) for k>1 ). Constant current charge and discharge usually requires normalizing the mass of the active material or the area of the electrode to obtain the specific capacity by weight or by area. In battery testing, a common unit of measure for capacity is the specific capacity by weight (mAh g-1), and is usually expressed in specific weight current density (A/g) or C (1 C refers to the current that fully charges the battery in 1 hour value) as a current measurement.
It should be pointed out that when making a full battery to match the capacity of the positive and negative electrodes, due to charge conservation, the area specific capacity (mAh cm-2) should be matched instead of the weight specific capacity (mAh g-1). Similarly, when conducting comparative experiments, the area specific capacity (mAh cm-2) should be controlled rather than the loading (mg cm-2). That is, C is more appropriate as a current metric, and weight-to-weight current density is only used when the effect of mass on capacity is negligible. However, in the current large amount of research work, the weight specific capacity is usually used for convenience, which means that a large number of excellent research results can only be obtained under the condition of very small loading.
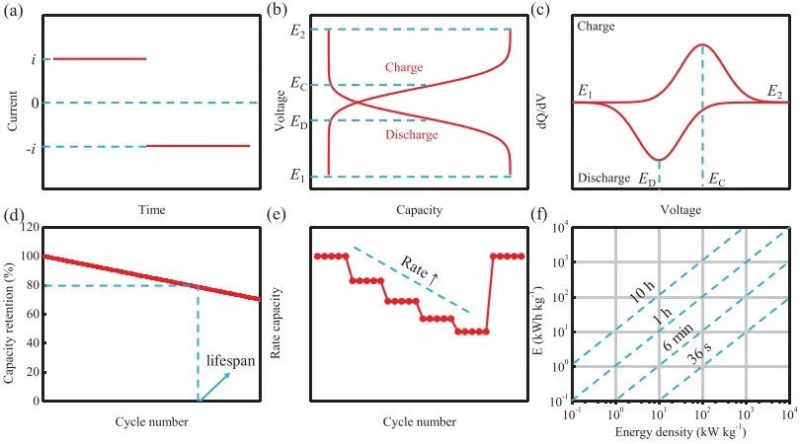
Figure 3 (a) Current curve of actual test (b) Relationship curve of voltage response and capacity actually recorded (c) Constant current charge-discharge test capacity-voltage integral curve during charge-discharge process (d) Cycle performance (e) Rate performance (f) Plot of power density versus corresponding energy density
The galvanostatic intermittent titration method (GITT) can measure the diffusion coefficient at each equilibrium state during the charge and discharge process. It should be noted that the discharge time should be short enough that a linear relationship can be established between E τ and τ 1/2 ( Figure 4c), only in this way the diffusion coefficient of the discharge process can be calculated by the following equation:

The diffusion coefficient of the charging process can also be calculated by the following equation:
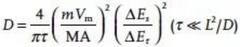
But Vm refers to the molar volume of the intermediate product, which varies with the concentration of ions intercalated into the electrode material. A is the electrochemical area, not the geometric area of the pole piece, nor the surface area of the active material. Because both of these areas are associated with binders and conductive additives, the uptake of charge in electrode materials is generally anisotropic, ie not all areas are electrochemically active for the charge.
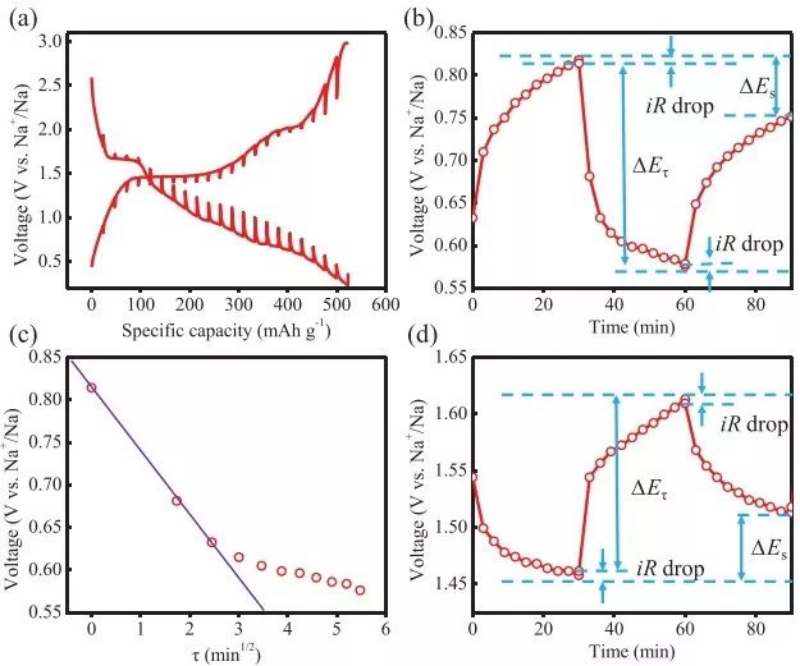
Figure 4 (a) Galvanostatic intermittent titration curve (b) Voltage vs time graph at a specific rest-discharge-rest phase (c) Voltage vs τ1/2 graph, τ is the discharge time (d) at a specific rest-charge - Graph of voltage vs time for the stationary phase
5.Impedance technology
Figure 5a shows the Nyquist diagram and the corresponding equivalent circuit (Randles circuit), where Rint is the inherent resistance of the battery system, Cdl is the electric double layer capacitance, Rct is the charge transfer resistance, and ZW is the Weber impedance, which is linear with the semi-infinite Diffusion is related and inversely proportional to the square root of frequency. The semicircle part of the high frequency region in Figure 5a starts from Rint, and its radius is half of Rct. When one more semicircle appears, it should be considered that one more capacitor exists in the equivalent circuit.
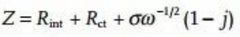
This is why an ideal Nyquist plot would have a 45° curve in the low frequency part. By fitting a linear relationship between Zre (real part) or Zim (imaginary part) and ω-1/2 (ω is the angular frequency), σ can be obtained and the diffusion coefficient can be calculated according to the following equation.
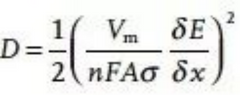
It can be obtained by integrating the open circuit voltage of Li+/Na+ at different concentrations (x), where A is also the electrochemical area, not the geometric area of the electrode material or the specific surface area of the active material. In the actual battery system, the electrode surface is rough and pseudocapacitance exists, and the actual diffusion of ions cannot be linearly diffused in a one-dimensional form, so that the high-frequency region appears arc rather than a semicircle, and the straight line in the low-frequency region is not 45°(Figure 5c). In this case, the electric double layer capacitor is replaced with a constant phase element.
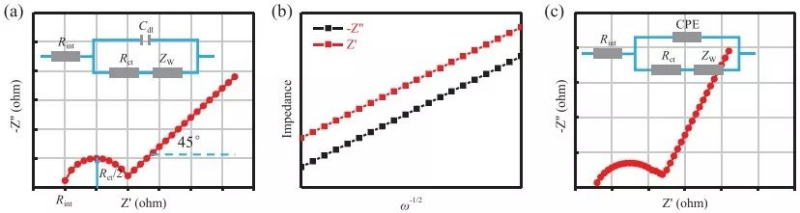
Figure 5 (a) Randles circuit model (blue) and its corresponding electrochemical impedance spectrum (red) (b) Zre (real part) or Zim (imaginary part) and ω-1/2 (ω is the angular frequency) Linear relationship between (c) deviated Randles circuit model (blue) and its corresponding electrochemical impedance spectrum (red)
6.Summary
This work introduces fundamental electrochemical concepts relevant to battery research, including measurement techniques for potential, current, and impedance. For practical reasons, a large number of electrochemical equations are cited in the article, which are very meaningful for understanding and analyzing the data. More importantly, the author discusses the common test techniques and analysis methods in battery research, emphasizes the use conditions of the corresponding electrochemical equations, and points out the inappropriateness of electrochemical analysis in current battery research.
This research result not only provides an introductory learning opportunity for researchers with non-electrochemical background to systematically master electrochemical theory, but also points out potential mistakes for researchers who already have electrochemical background knowledge, and improves everyone's knowledge of electrochemistry. It provides theoretical guidance for the design, research and optimization of batteries including cathode materials.