

The EIS spectrum can be used to analyze the lithium insertion process of the spinel LiMn2O4 electrode. According to Voigttype, Frumkin and McKik Gaykazyan (FMG) model, the equivalent circuit diagram of EIS spectrogram design, and the meaning of the components at different stages are shown in Figure 1.

Figure 1 Equivalent circuit of lithium insertion process
The Voigt-type part is connected in series by an RC circuit, which represents the migration of lithium ions in the multilayer surface film and the transfer of interface charges; and the FMG represents the solid-state diffusion (a specific linear Warburg impedance) and the accumulation of the amount of insertion ( Cint and Warburg type impedance connected in series embedded capacity).
From 2.0V to 4.0V, the spectrum gradually changes. The lithium insertion process is divided into three different stages according to different potentials. From 2.00V to 2.70V is the first stage [Figure 2(a)], only a part of the arc is shown in the high-frequency part, but it cannot be measured in the low-frequency part. As the potential increases, the impedance value decreases. Small, not the chemical reaction resistance commonly thought, but the structural force to be overcome when inserting and extracting in the active material, because the spinel structure of LiMn2O4 at this time is distorted due to the Jahn-Teller effect. This The transformation of this kind of structure leads to a sharp increase in the resistance to be overcome for the insertion and extraction of lithium ions in the crystal. The lower the potential, the greater the resistance to the insertion and extraction of lithium ions. This may be because the lower the potential, the more distorted the structure of LiMn2O4 .
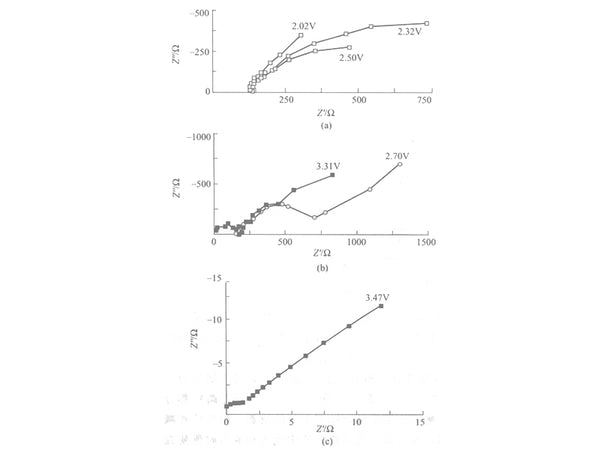
Figure 2 AC impedance diagram of LiMn2O4 electrode at 3.94V
From 2.70V to the charge and discharge platform area before the second stage [Figure 2 (a) and Figure 2 (b)], that is, the non-charge and discharge platform area.
As the potential increases, the electrochemical reaction resistance begins to decrease. At this stage, the free lithium ions and the complex groups of lithium ions in the electrolyte form an electric double layer on the interface between the electrolyte and the electrode near the positive electrode. However, due to the relatively small volume of lithium ions, it is easier to insert and extract from the electrode surface; while the lithium ion complex group is relatively large, and it is not easy to enter and exit the electrode surface layer, thereby adsorbing on the electrode surface, as the potential gradually increases As it rises, the resistance to insertion and extraction of lithium ions becomes smaller and smaller, so the electrochemical reaction resistance becomes smaller and smaller. The semicircle in the high-frequency region at 3.47V corresponds to the Rct in the model, because the electric double layer of the interface has not yet been fully formed at this time, so the electrochemical reaction resistance is very small. In the low-frequency region, the Warburg impedance represents the lithium ion in the active material of the electrode. Diffusion in the surface layer.
The third stage starts from entering the platform area (Figure 3 and Figure 4). With the gradual increase of the potential, the AC impedance spectroscopy changes significantly. After entering the charging platform area, the semicircle that appears at high frequencies is still electrochemical. Reaction resistance, which corresponds to the Rct in the model, but at this time because the interface electric double layer has been formed, the electrochemical reaction resistance is larger than that in Figure 2, and after entering the charge and discharge platform area, lithium ions enter the surface of the active material , There is an electron-poor zone in the area close to the electrode surface. The lithium ions entering the active material from the electrolyte and the electrons transferred from the current collector reach a balance, so a capacitive reactance appears in the low-frequency region. The increase of the organic group desorbs from the electrode surface, thus an inductive reactance appears in the middle frequency region. The semicircle in the low frequency part depends on the potential at which it is located. The greater the potential, the greater the driving force of the electrons. , The easier the electrons are transported in the particles; the second semicircle represents the impedance of the electrons passing through the channel to reach the active material, and Warburg impedance begins to appear in the ultra-low frequency region, which is the diffusion of lithium ions in the active material.

Figure 3 AC impedance diagram QQ of LiMn2O4 electrode

Figure 4 AC impedance diagram of LiMn2O4 electrode at 4.0V
Through the above analysis of the impedance spectra of spinel LiMn2O4 and combined with the equivalent circuit, it can be considered that the spinel LiMn2O4 electrode has different electrochemical behaviors at different potentials, which can be divided into three stages: structural collapse area, non-charged area Discharge platform area and charge and discharge platform area. When the electrode potential is not in the charging and discharging platform area, the impedance spectrum shows a capacitive reactance and linear Warburg impedance. When the electrode potential is in the charging and discharging platform area, the first semicircle is still lithium ions covering the surface of the LiMn2O4 electrode. For the migration in the membrane, the second semicircle represents the impedance of the electron passing through the channel to the active material, while the intermediate frequency semicircle may be caused by the adsorption and desorption behavior of the lithium ion complex group.