

Main content:
- Calculation example of N/P ratio of traditional graphite onode lithium-ion battery
- The effect of different N/P ratios on the performance of lithium titanate anode lithium batteries
- Effects of different N/P ratios on battery capacity
- Effects of different N/P ratios on the high temperature storage performance of batteries
- Effects of different N/P ratios on battery cycle performance
- Three-electrode test with different N/P ratios
- Conclusion
When designing lithium batteries, it is very important to correctly calculate the reasonable ratio of cathode and anode capacity. For traditional graphite anode lithium-ion batteries, the shortcoming of battery charge-discharge cycle failure mainly lies in the occurrence of Li plating and dead zone on the anode side, so the scheme of excessive anode is usually adopted. In this case, the battery capacity is limited by the cathode capacity, and the anode capacity/cathode capacity ratio is greater than 1.0 (ie, N/P ratio > 1.0).
If the cathode is excessive, the excess lithium ions from the cathode cannot enter the anode during charging, and will form lithium deposition on the surface of the anode, resulting in the formation of dendrites, resulting in poor battery cycle performance. Therefore, in general graphite anode lithium batteries will have slightly more anode than cathode, but not too much, too much will consume lithium in cathode. In addition, it will also cause anode waste, reduce battery energy density, and increase battery cost.
For lithium titanate anode batteries, due to the relatively stable structure of LTOanode, high voltage platform, excellent cycle performance and no Li plating phenomenon, the cause of cycle failure is mainly at the cathode side. The preferred solution for battery system design is to use excess cathode and anode capacity limit (N/P ratio < 1.0), which can alleviate the decomposition of the electrolyte due to the high cathode potential in the high-potential region when the battery is close to or in a fully charged state.
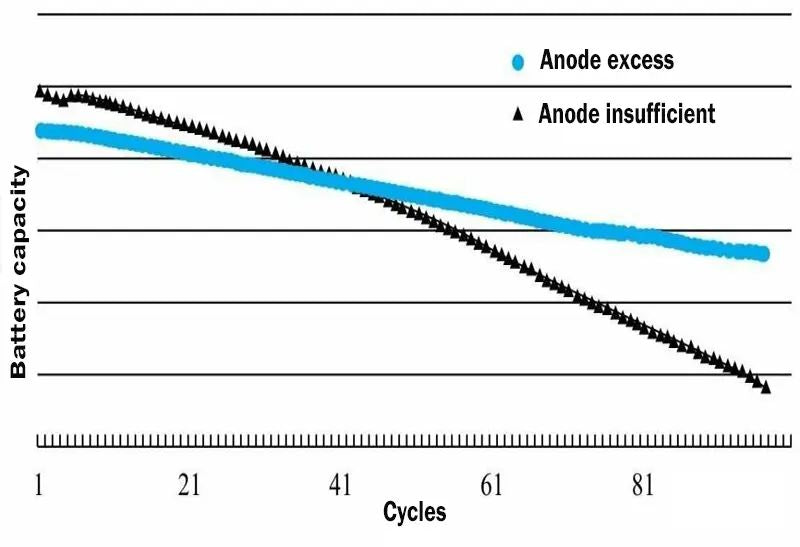
Figure 1. The trend of battery performance when graphite anode is insufficient and anode is excessive
1.Calculation example of N/P ratio of traditional graphite onode lithium-ion battery
N/P ratio (Negative/Positive) refers to the ratio of anode capacity and cathode capacity. In fact, there is another way of saying it is called CB (cell Balance). In general, the ratio of cathode and anode in the battery is mainly determined by the following factors:
- First efficiency of cathode and anode materials: all reacting substances should be considered, including conductive agents, binders, current collectors, diaphragms, and electrolytes.
- The coating accuracy of the equipment: Now the ideal coating accuracy can be 100%. If the coating accuracy is poor, it should be considered.
- Decay rate of cathode and anode cycle: If the cathode decays quickly, then N/P is lower than the design, so that the cathode is in a shallow charge and discharge state. On the other hand, if the Anode decays quickly, the N/P ratio is higher, so that the Anode is in a shallow charging and discharging state.
- The rate capability to be achieved by the battery.
The calculation formula of N/P: N/P=anode area density×active material ratio×active material discharge specific capacity/cathode area density×active material ratio×active material discharge specific capacity.
For example: LiCoO2 in the voltage range of 4.2 ~ 3.0V, at 25 ℃, the first-round charge-discharge efficiency is about 95%, and the first-round charge-discharge efficiency of ternary materials is between 86% and 90%. Table 1 shows the mass specific capacity of commercial NCM111 for the first three charge-discharge cycles of 1C discharge.
|
Cycle times |
Charge specific capacity/(mA.h.g-1) |
Discharge specific capacity/(mA.h.g-1) |
|
1 |
168 |
145 |
|
2 |
145 |
145 |
|
3 |
145 |
145 |
Table 1 Specific capacities of commercial NCM111 batteries in the first three charge-discharge cycles
Before using the material ratio, it can be calculated according to the first round of efficiency data provided by the material manufacturer. If the manufacturer does not provide it, it is best to use a button half cell to test the first-round efficiency of the material, so as to calculate the ratio of cathode and anode. The ratio of cathode and anode of lithium battery of graphite anode can be calculated according to the empirical formula N/P=1.08, N and P are the mass specific capacity of the active material of anode and cathode respectively.
The calculation formulas are shown in formula (1) and formula (2). Excessive anode is beneficial to prevent the deposition of lithium on the surface of the anode when the battery is overcharged, and is beneficial to improve the cycle life and safety of the battery. N=anode area density × active material ratio × active material discharge specific capacity (1); P = cathode surface density × active material ratio × active material discharge specific capacity (2)
Assuming that the cathode areal density is 200 mg·cm–2, the active material ratio is 90%, and the discharge specific capacity is 145 mA·h·g–1, then P=200 mg·cm–2×0.9×145 mA·h·g–1 = 26.1 mA·h·cm–2. Assuming that the active material ratio of the anode is 95% and the discharge specific capacity is 320mA·h·g–1, the areal density of the anode is designed to be 93 mg·cm–2 is more appropriate, at this time N=93mg·cm–2×0.95×320 mA·h·g–1 = 28.3 mA·h·cm–2, N/P=1.084.
Because the irreversible capacity of the battery material in the first round will also affect the ratio of cathode and anode, the above calculation should also be verified with the charging capacity of the first round. According to Table 2, the first-round charge-discharge efficiency of LiCoO2 is 95%, the first-round charge-discharge efficiency of NCM111 is 86%, and the first-round charge-discharge efficiency of anode is 90%. Their charging capacities are 153 mA h g–1, 169 mA h g–1, and 355 mA h g–1, respectively.
|
Cathode and anode materials |
NCM111 |
LiCoO2 |
Natural graphite |
|
1C discharge gram capacity |
145 |
145 |
320 |
|
1C charge gram capacity |
169 |
153 |
366 |
|
1C premiere efficiency |
0.86 |
0.95 |
0.90 |
Table 2 Cathode and anode material first discharge capacity and efficiency (typical value)
- PLCO=27.54mA·h·cm–2
- N=31.36 mA·h·cm–2
- N/PLCO=1.138
- P111=30.42mA·h·cm–2
- N/P111=1.03
Generally speaking, the ratio of N,/P calculated by the charging capacity should be greater than 1.03. If it is lower than 1.03, the ratio of cathode and anode should be fine-tuned again. For example, when the cathode first-round efficiency is 80%, the above cathode charging capacity is 181 mA h g–1, then P=32.58 mA h cm–2, N/P=0.96. At this time, the surface density of cathode and anode should be adjusted so that N/P is greater than 1, preferably around 1.03. For mixed cathode materials, it is also necessary to calculate according to the above method.
2.The effect of different N/P ratios on the performance of lithium titanate anode lithium batteries
① Effects of different N/P ratios on battery capacity
In this study, a flexible packaging lithium-ion battery was fabricated using ternary NCM as cathode material and lithium titanate LTO as anode material; The experimental plan of using fixed cathode capacity and changing anode capacity, that is, setting cathode capacity to 100, and designed anode capacity to be 87, 96, 99, and 102, respectively, as shown in Figure 2. When the N/P ratio is less than 1.0, the anode capacity is insufficient, the cathode capacity is excessive relative to the anode capacity, and the battery capacity is limited by the anode capacity;
As the anode capacity is high, that is, the N/P ratio increases, the battery capacity increases accordingly; When N/P is higher than 1.0, the cathode capacity is insufficient relative to the anode capacity, and the battery capacity is limited by the cathode capacity. Even if the anode capacity is increased, the battery capacity will remain unchanged. It can be seen that under this experimental scheme, the battery capacity increases with the increase of the N/P ratio.
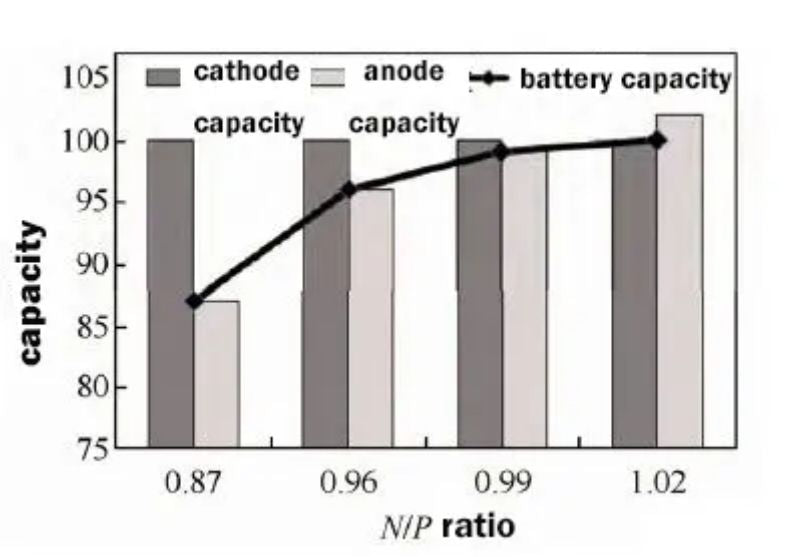
Figure 2. Schematic diagram of the relationship between the four N/P ratios and cathode and anode capacity and battery capacity
The full battery capacity test also verifies the above analysis. As shown in Figure 3(a), the full battery capacity increases from 2430 mA h to 2793 mA h as the N/P ratio increases. By calculating the gram capacity of cathode and anode materials, the change trend of gram capacity with N/P ratio is obtained. As shown in Figure 3(b), it can be seen that increasing the N/P ratio can improve the gram capacity of cathode materials and the battery capacity.
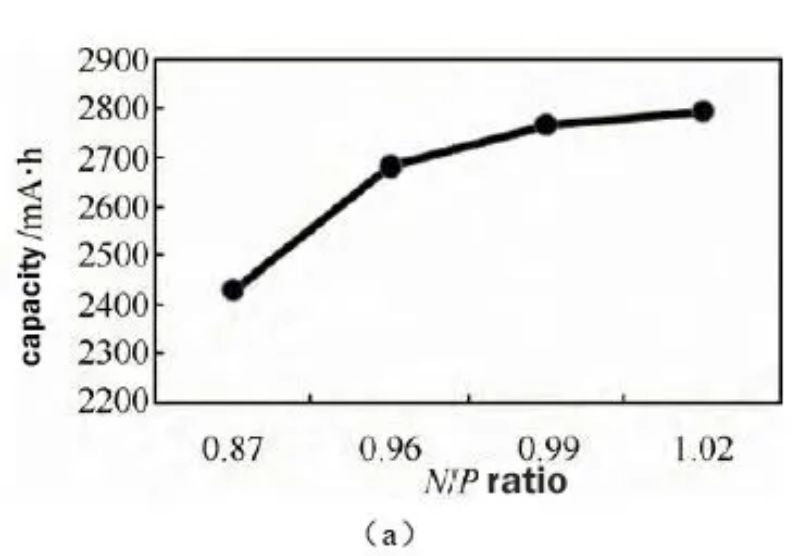
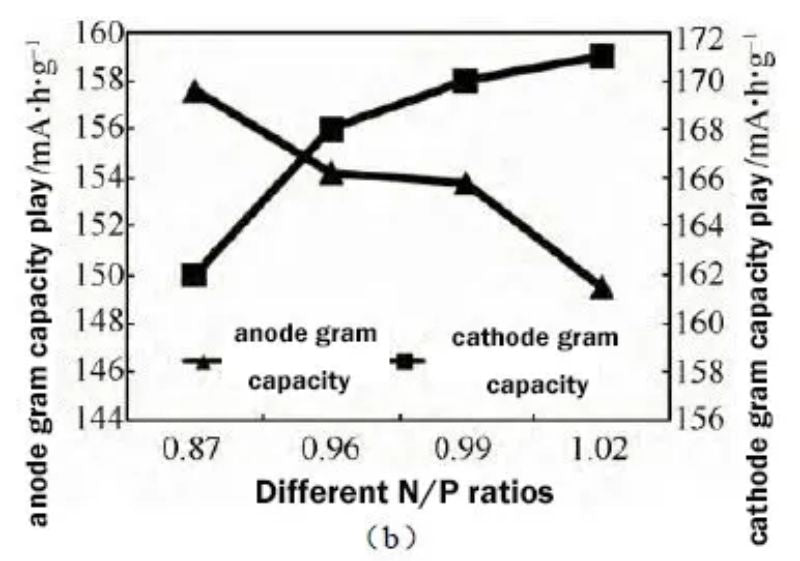
Figure 3 (a) The effect of different N/P ratios on battery capacity (b) The effect of different N/P ratios on cathode and anode gram capacity
② Effects of different N/P ratios on the high temperature storage performance of batteries
The high-temperature storage (60 ℃, 100% SOC) test is to charge at 1.0C to 2.8V/0.1C to cut off, set aside for 5min, put it at 1.0C to 1.5V, and cycle 3 times to select the highest capacity as the initial capacity; Then, the cell is charged at 1.0C to 2.8V/0.1C, and the full-charge voltage, internal resistance and full-charge thickness before storage are tested, and the values are recorded;
After the cells were stored at 60°C for 7 days, the full-charged voltage, internal resistance and full-charged thickness of the corresponding cells after storage were measured. Then put the cell at 1.0C to 1.5V to record the residual capacity, charge the cell at 1.0C to 2.8V/0.1C cut-off, put it on hold for 5min, and put it at 1.0C to 1.5V. The discharge capacity after 3 cycles was recorded as the recovery capacity, and the test results are shown in Fig. 3(a).
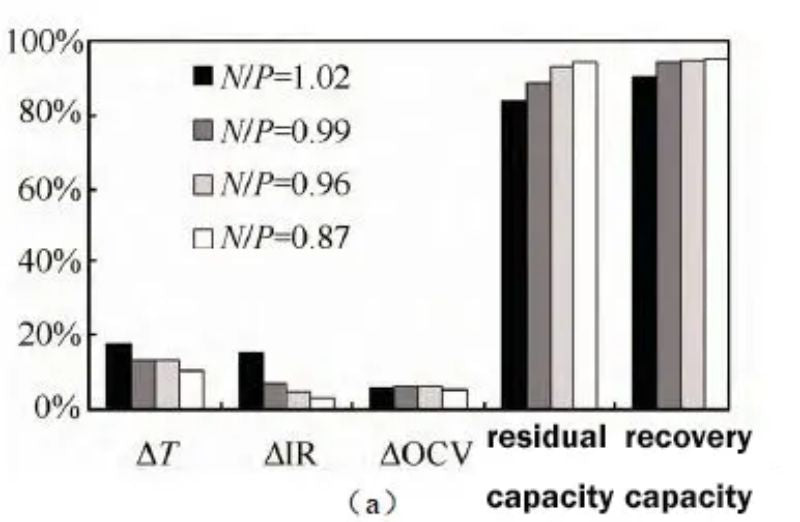
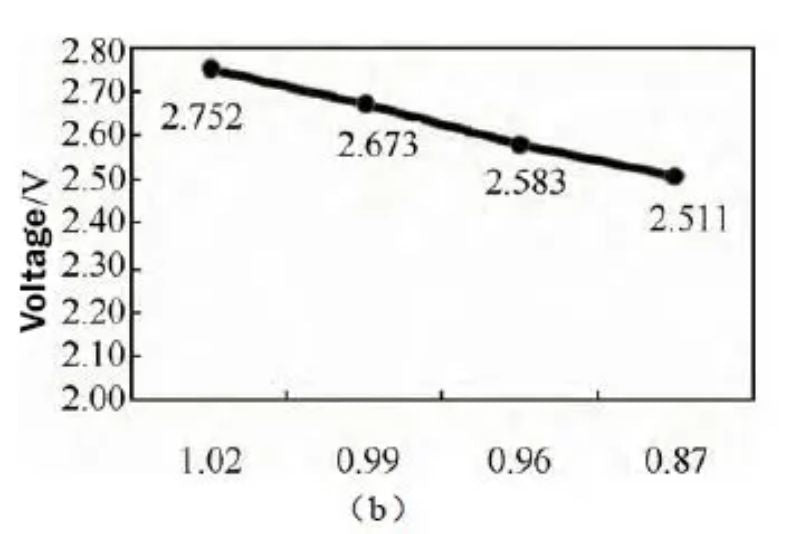
Figure 4 (a) Effects of different N/P ratios on battery thickness, internal resistance, voltage, and residual capacity recovery after storage at 60 °C; (b) Battery voltages with different N/P ratios before storage at 60 °C
For the battery with N/P ratio of 0.87, the thickness expansion rate was the smallest at 13.4% after being fully charged at 60 °C for 14 days; the battery with N/P ratio of 1.02 had the highest thickness at 17.5%. As the N/P ratio decreases, the thickness expansion of the battery at high temperature storage decreases gradually. Similarly, the internal resistance growth of the battery with low N/P ratio is also lower, 0.03 mΩ; the internal resistance growth of the battery with high N/P ratio is higher, 0.15 mΩ.
Residual and recovery capacities increase gradually with decreasing N/P. The voltage test before storage found that, as shown in Figure 3(b), as the N/P ratio decreased, the voltage gradually decreased, and the battery voltage was 2.411V when the N/P ratio was 0.87. The low battery terminal voltage can reduce the internal side reactions of the battery when it is stored at high temperature, which is beneficial to improve the residual and recovery capacity. It can be seen that reducing the N/P ratio is beneficial to improve the high temperature storage performance of the battery.
③ Effects of different N/P ratios on battery cycle performance
The NCM/LTO system batteries with three different N/P ratios (0.87/0.99/1.02) were subjected to 3C charge and 3C discharge cycle tests, with a voltage range of 2.8 to 1.5 V, and the cycle capacity retention rates under three N/P ratios are shown in the figure 5(a). It can be seen from the figure that the battery with an N/P ratio of 0.87 has the best cycle performance, and the capacity retention rate is 97% after 1600 cycles. However, when the N/P ratio was increased to 0.96 and 1.02, the cycle capacity retention rate became significantly worse.
The change rate of internal resistance during the cycle is shown in Fig. 5(b), the internal resistance increase rate is the smallest when the N/P ratio is 0.87, and the internal resistance increases by 7.6% after 1800 cycles. When the N/P ratio was increased to 1.02, the internal resistance increased sharply to 34% after 1800 cycles. It can be seen that the design of the N/P ratio of the battery has a great influence on the cycle performance, and a low N/P ratio is more beneficial to the battery cycle performance.
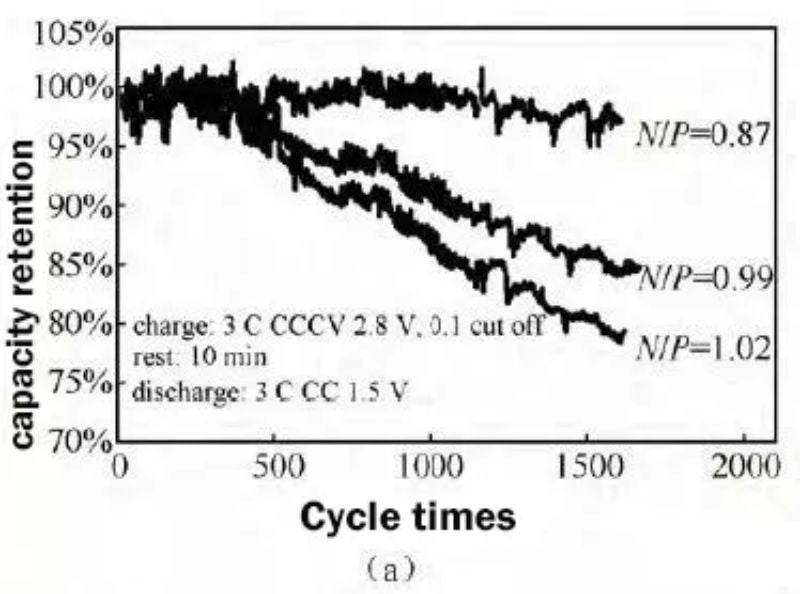
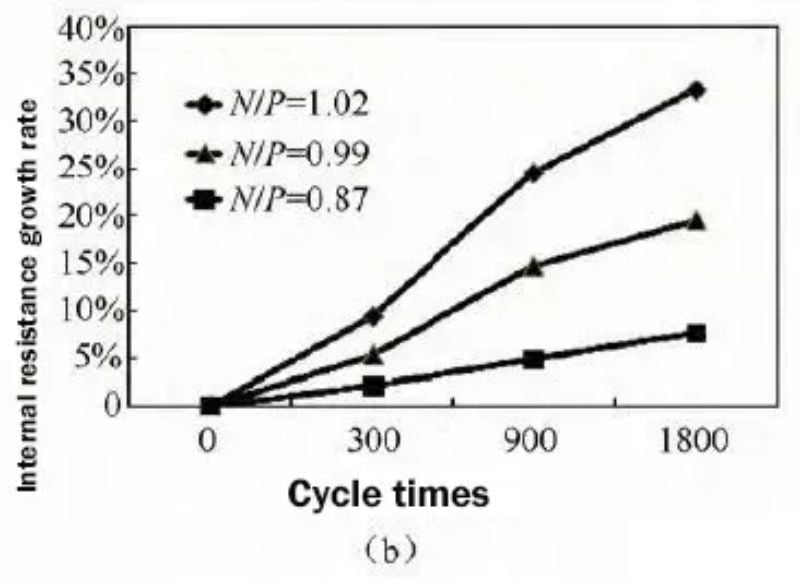
Fig.5 Comparison of cycle capacity retention (a) and cycle internal resistance growth rate (b) with different N/P ratios
④ Three-electrode test with different N/P ratios
Three-electrode tests were carried out on batteries with different N/P ratios. The test conditions were: 3C constant current charge to 2.8V, 0.1C cut-off, sleep for 30 min, and 3C discharge to 1.5V. The test results are shown in Figure 6.
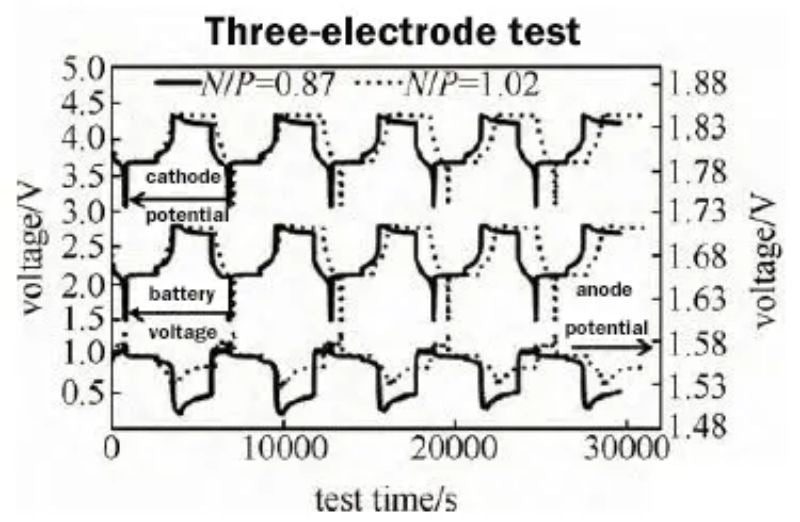
Fig. 6 Monitoring of cathode and anode potential of two N/P ratio batteries
The cathode potential of the battery with N/P ratio of 0.87 decreased from 4.325 V in the initial stage of constant voltage charging to 4.295 V in the final stage of constant voltage charging, and continued to decrease to 4.215 V in the subsequent 30 min dormancy. The cathode potential with an N/P ratio of 1.00 remained basically unchanged at 4.335 V in the constant voltage charging section, and decreased to 4.321 V during the 30-min dormancy process.
The potential of the anode with N/P ratio of 0.87 decreased from 1.56 V to 1.50 V, and the potential of the anode with N/P ratio of 1.00 remained almost constant, only decreased from 1.56 V to 1.54 V. The battery voltage with an N/P ratio of 0.87 decreased from 2.8 V to 2.69 V during the 30 min dormancy process, and the battery voltage with an N/P ratio of 1.00 remained basically unchanged, only decreasing from 2.8 V to 2.77 V.
It can be seen that the cathode potential with low N/P has a large voltage drop during the constant voltage charging period and the subsequent dormancy process. The cathode potential with N/P of 0.87 is significantly lower than the cathode potential of N/P of 1.0. It can be seen from the three-electrode test that for LTO anode, the voltage platform is around 1.55V, and most of the electrolyte solvents have stable electrochemical performance on the lithium titanate anode side.
However, the cathode side has a higher potential, and the electrolyte is easy to Oxidation reactions take place on the cathode side, especially near full charge state. Therefore, for a battery system with an N/P ratio less than 1 (LTO limited capacity), when the battery is fully charged, the anode potential will decrease from 1.56V to 1.50V, and the cathode potential will decrease from 4.325V to 4.325V in the constant voltage charging section. 4.295V, which continues to decrease to 4.215V during the subsequent 30min dormant depolarization process;
For a battery system with an N/P ratio greater than 1 (cathode limited capacity), the LTO is excessive relative to the cathode, and the potential of LTO remains basically unchanged at about 1.55V during the charging process, only decreasing from 1.56V to 1.54V. The cathode potential remained unchanged at 4.335 V during the constant voltage charging process, which was higher than the cathode potential of 4.295 V in the low N/P ratio battery. The higher cathode voltage state makes it easier for side reactions such as oxidation to occur between the electrolyte and the cathode, resulting in poor cycling performance and high-temperature storage performance.
3.Conclusion
For lithium titanate anode lithium-ion batteries, increasing the N/P ratio is beneficial to the performance of the battery’s cathode gram capacity, which is beneficial to improve the initial discharge capacity of the battery; However, increasing the N/P ratio will increase the cathode electrode potential, and the electrolyte is prone to oxidation reaction on the cathode side, especially when it is close to the fully charged state.
The low N/P ratio can ensure that the cathode has a low electrode potential, thereby reducing the internal side reactions of the battery during high-temperature storage and cycling, which is beneficial to improve the battery high-temperature storage performance and lithium battery recycling performance. When the energy density requirement is not high, in order to ensure long life cycle and good high temperature performance, the N/P ratio can be appropriately reduced to between 0.85 and 0.9.