
Main content:
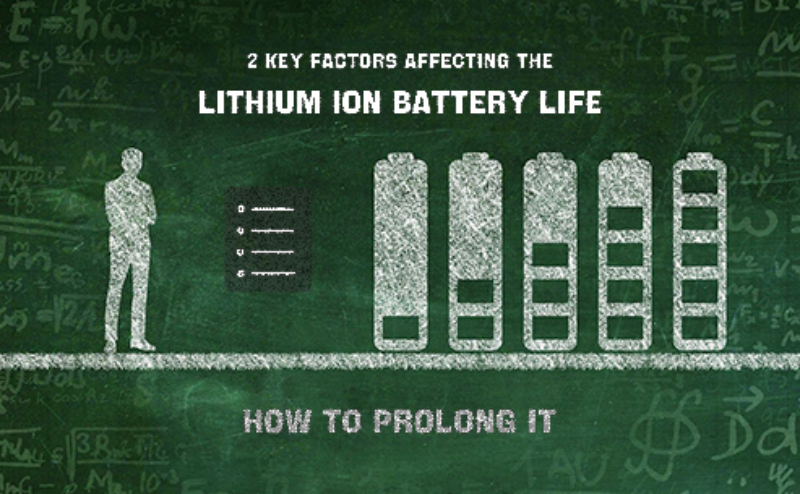
Lithium-ion batteries have many advantages such as higher operating voltage, larger specific energy, smaller size, lighter weight, longer cycle life, lower self-discharge rate, without memory effect and non-pollution. Therefore, high capacity lithium ion battery is widely used in 3C products, power, energy storage and other fields. Naturally, the lithium ion battery life is one of the most concerned properties. The lithium ion battery life is mainly affected by two factors, one is the original cell design, and the other is the use environment.
Among the original design parameters, the selection of positive and negative materials, N/P ratio, electrolyte selection, production process, production environment, quality control, etc., will have a great impact on the life of the battery. This article aims to introduce in detail two key factors that affect lithium ion battery life in the use environment, one is the depth of charge and discharge, and the other is the operating temperature. I believe this article can help you better understand how the lithium ion battery life is affected, and help you pay attention to these problems during use to prolong the lithium ion battery life.
1.Depth of charge and discharge
The depth of charge and discharge is actually two concepts, the depth of charge and the depth of discharge, the corresponding abbreviations are DOD (Depth of discharge) and DOC (Depth of charge). The electrochemical definition of charge-discharge depth is the ratio of charge-discharge capacity to rated capacity.
① Influence of charging depth on lithium ion battery life
There are generally two ways to design experiments with different charging depths: one is to determine different charging depths based on voltage; the other is to determine different charging depths based on charging capacity. The first one is to determine the corresponding charging voltage value of each cell in the SOC state under investigation, and then perform a charge-discharge cycle with this voltage value as the charge-off voltage to investigate the change of its discharge capacity. The relevant experimental data are as follows:
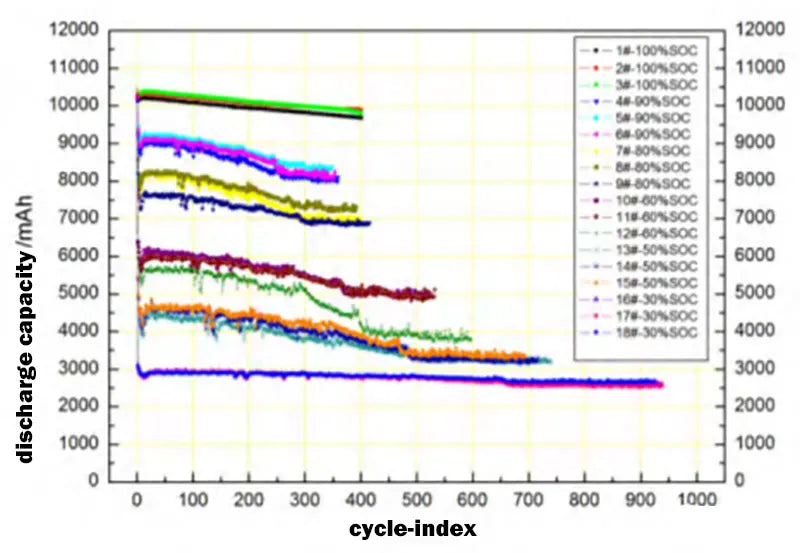
Determine different charging depths based on voltage
It can be seen that in this way, the charging capacity at all charging depths decreases, and on the overall trend, as the SOC decreases, it first decreases gently and then increases. Under the three SOCs of 90%, 80%, and 60%, the maximum capacity retention rates are 88.6%, 88.2%, and 85.8%, respectively, while the maximum capacity retention rate of 50% is only 80.0%, and the capacity retention rate of 30% SOC is rose to more than 90%.
The second is to charge to the corresponding specified SOC capacity in a constant current manner and then discharge, specified SOC capacity = rated capacity × corresponding SOC. With the decrease of the charging SOC state, the lifespan increases sequentially. For example, taking the lifespan of 100% SOC as the reference value, compare the samples with the best lifespan under each SOC with it, and obtain the relative lifespan comparison under each SOC:
|
SOC |
Life/times |
Relative life |
Relative longevity increase(10%SOC) |
|
100% |
990 |
1 |
0 |
|
90% |
1405 |
1.42 |
0.42 |
|
80% |
2952 |
2.98 |
1.56 |
|
60% |
6555 |
6.62 |
1.82 |
|
50% |
12154 |
12.28 |
5.66 |
|
30% |
19243 |
19.44 |
3.58 |
Table 1 Comparison of the relative life of SOC
From the above data, it can be concluded that the change rule of cycle life and charging SOC of LFP batteries is that with the decrease of charging SOC, the cycle life is significantly improved.
② Influence of depth of discharge on lithium ion battery life
How does depth of discharge affect battery life? The experiment selected two DOD values as the test objects, but each DOD set a different SOC interval, which should more objectively reflect the battery cycle life under different discharge conditions. As shown below:
|
Designing scheme |
Plan 1 |
Plan 2 |
Plan 3 |
Plan 4 |
Plan5 |
Plan 6 |
|
Depth of discharge(DOD) |
20% |
20% |
20% |
20% |
20% |
20% |
|
SOC |
100% |
60% |
20% |
100% |
90% |
80% |
|
SOC |
80% |
40% |
0% |
20% |
10% |
0% |
Table 2 Battery cycle life under different discharge conditions
The data obtained by the experiment is also intuitive, as shown in the following figure:
|
Scheme |
Week 0 |
Week 50 |
Week 100 |
Week 200 |
Week 300 |
Week 400 |
Week 500 |
Cyclic decay rate |
|
Plan 1 |
100.0 |
101.0 |
99.6 |
99.1 |
98.7 |
98.4 |
98.0 |
2.0 |
|
Plan 2 |
100.0 |
101.3 |
100.3 |
99.9 |
99.7 |
99.5 |
99.4 |
0.6 |
|
Plan 3 |
100.0 |
100.8 |
99.7 |
99.2 |
98.7 |
98.4 |
98.1 |
1.9 |
|
Plan 4 |
100.0 |
99.9 |
98.5 |
97.0 |
95.3 |
94.2 |
93.0 |
7.0 |
|
Plan 5 |
100.0 |
100.9 |
99.2 |
98.4 |
97.3 |
96.1 |
95.1 |
4.9 |
|
Plan 6 |
100.0 |
100.1 |
99.0 |
97.6 |
96.2 |
95.1 |
93.9 |
6.1 |
Table 3 Experimental data of battery cycle life under different discharge conditions
From this, it can be concluded that when the battery SOC is around the median value and the DOD is small, the cycle decay is low. The larger the DOD, and the closer the discharge start SOC and the stop SOC are to the upper and lower limits, the faster the capacity decay is. Therefore, from the depth of discharge experiment, it can be concluded that the middle SOC range should be used as much as possible when the battery is discharged.
2.Working temperature
The influence of working temperature on lithium ion battery life is mainly reflected in the influence of electrolyte viscosity, ion migration rate and side reactions on the microscopic level. Theoretically speaking, the viscosity of the electrolyte and the speed of ion migration will improve the performance of lithium-ion batteries as the temperature increases, but excessive temperature will lead to aggravation of side reactions in the battery, which is not conducive to the long-term use of the battery.
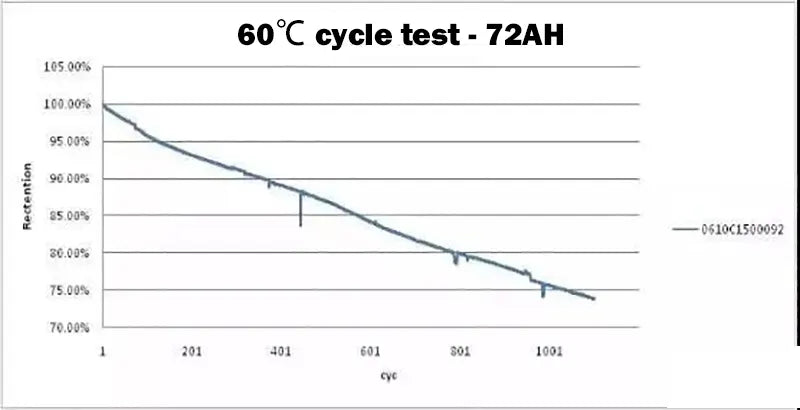
The lower the temperature, the slower the lithium-ion migration rate, the more polarized the battery, and the more degraded the performance of the lithium-ion battery. At the same time, charging at too low temperature can easily lead to lithium plating, which affects the safety of the battery and causes great damage to the battery. So avoid low temperature charging. The following data are used to illustrate:
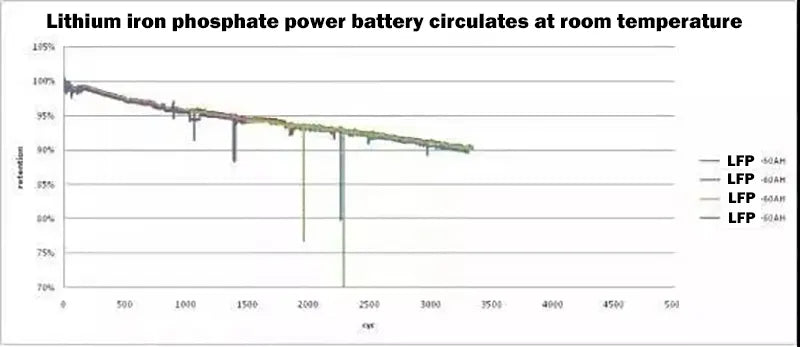
A certain type of single lithium iron phosphate battery is cycled at room temperature, and the capacity retention rate is about 90% after 3000 cycles. The battery was cycled at 60 ℃ for 1000, and the capacity retention rate was about 75%.
3.Summary
It can be seen from the above that in order to make the lithium battery last longer, and then provide longer service for your equipment, such as golf cart batteries that power golf carts, etc. It is necessary not only to pay attention to the charging and discharging strategy, but also to use it in a suitable temperature range.
Related article: BMS for lithium ion battery, lithium ion battery electrolyte