


When high-speed moving electron beams (ie, cathode rays) collide with objects, their movement is drastically stopped, thereby losing their kinetic energy. A small part of the energy becomes the energy of X-rays, and X-rays are generated. Part of the energy is converted into heat, which increases the temperature of the object.
X-rays travel along a straight line and have high penetrating power. All elementary particles (electrons, neutrons, protons, etc.) are accompanied by X-ray radiation when their energy state changes.
In 1912, based on previous work, M.Laue et al. used crystals as a grating to produce ray diffraction, so that the rays were incident on a certain crystal, and successfully observed the X-ray diffraction phenomenon, thus confirming X-ray is essentially an electromagnetic wave with a wavelength in the range of 10-12~10-8m.
The rays emitted by the X-ray tube are divided into two types: one is X-rays with continuously changing wavelengths, which constitute a continuous X-ray spectrum. It is similar to white visible light and contains radiation of different wavelengths, so it is also called white X-ray or polychromatic X-ray. The other is X-rays with specific wavelengths, which are superimposed on the continuous X-ray spectrum and are called identification (or characteristic) X-rays. When the high pressure applied to the ray tube reaches a certain value, the marking spectrum can be generated. The wavelength of the marking spectrum depends on the material of the anode target in the X-ray tube. Because they only have a specific wavelength and are similar to monochromatic visible light, they are also called monochromatic X-rays. Various monochromatic X-rays constitute identification X-rays (or characteristic X-ray spectra).
When a certain high voltage is applied between the two poles of the X-ray tube of a certain metal target and a certain tube current is maintained, the relationship between the wavelength and the relative intensity of the ray produced by it is measured as shown in Figure 1. The emitted X-ray is a continuous spectrum, which contains all the wavelengths starting from a certain short-wavelength limit λ0, and the intensity changes continuously with the wavelength.
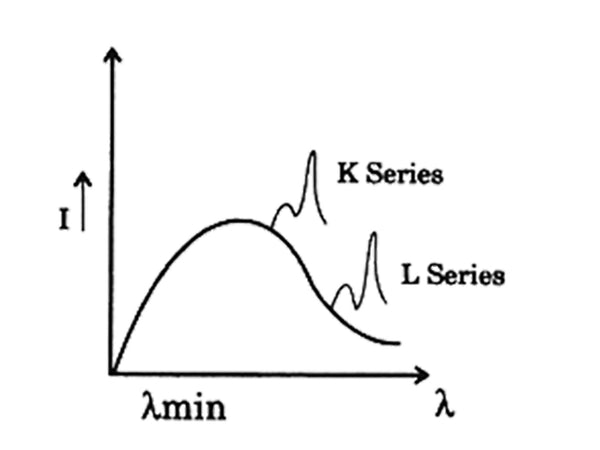
Figure 1 Schematic curve of the relationship between the wavelength of the X-ray tube and the relative intensity
The continuous spectrum satisfies the following experimental rules.
① The relative intensity of rays of various wavelengths increases with the increase of the voltage of the X-ray tube. The wavelength λm corresponding to the maximum intensity rays becomes smaller, and the short-wavelength limit λ0 becomes smaller.
②When the tube voltage is constant, the relative intensity of rays of various wavelengths increases with the increase of tube current, but λ0 and λm remain unchanged, as shown in Figure 2.

Figure 2 The influence of tube current on X-ray spectrum curve
③The relative intensity of various wave reflection lines increases with the increase of the atomic number of the anode target material, as shown in Figure 3.
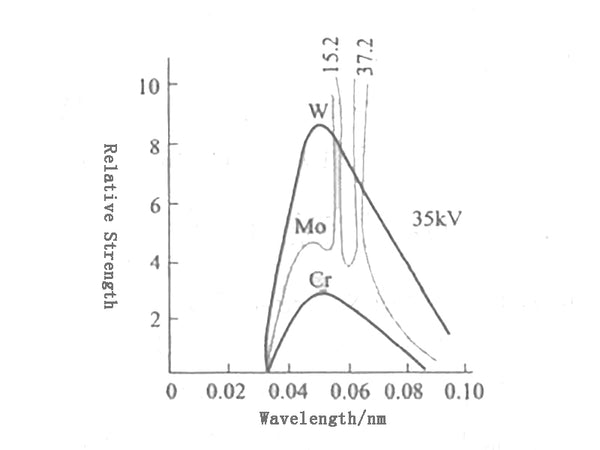
Figure 3 The influence of the target material on the X-ray spectrum curve
According to quantum theory, when an electron with an energy of eV collides with the anode material, a photon with an energy ≤ eV is produced. Therefore, radiation has an upper frequency limit v, which corresponds to the short-wave limit λ0, which can be expressed as:
eV=hυm=hc/λ0
In the formula, e——the charge of the electron, 1.60×10⁻⁹C;
v——The voltage drop when electrons pass through the two poles, that is, the voltage applied to the two poles of the X-ray tube, V;
h——Planck's constant, 6.63×10⁻³⁴·s;
υm——The frequency of X-rays, s-1;
c——The speed of light in vacuum, 3.00×10⁸m/s;
λ0——short wave limit of continuous X-ray, m.
Under normal circumstances, an electron with an energy of eV collides with the anode target material, and after a photon hv1 is generated, its own energy becomes eV1. The electrons with energy eV1 continue to collide with the atoms in the anode target to produce a photon hv2, and the electron energy becomes eV2… that is, multiple radiations are carried out. It can be expressed as:
eV=hυ1+hυ2+hυ3+…
Therefore, a continuous spectrum appears, which extends from the short-wave limit to the long-wave direction.
The physical quantity describing the number of X-rays—intensity (I) refers to the energy passed in a unit time on a unit area perpendicular to the direction of X-ray propagation, that is, the number of photons. The commonly used unit is erg/(cm²·s) (in the SI system, the unit is W/m²). Kulenkampff summed up an empirical formula from a large number of experimental results, namely: if the wavelength is between λ and λ+dλ Is Iλdλ (Iλ is called the intensity density for the wavelength λ), then:
Iλdλ=AiZ[(1/λ²)(1/λ0)﹣(1/λ)]dλ
In the formula, Z——the atomic number of the anode target material;
i——current intensity of X-ray tube;
A-constant.
Integrate the above formula from λ0 to λ∞ to obtain the total intensity of continuous X-rays emitted under certain conditions:
I connection=∫λ∞λ0Iλdλ=(AiZ/2λ²0)=KiZV²
It can be seen that the total intensity of continuous X-rays is proportional to the square of tube current intensity i and tube voltage V. Therefore, substances with high atomic number such as tungsten are often used as the anode of the X-ray tube, because it can obtain a larger total intensity of the continuum.
Keep the tube current of the X-ray tube constant and gradually increase the target tube voltage. When the tube voltage is lower than a certain value, a continuous spectrum can be obtained. When the tube voltage exceeds this specific value, a number of characteristic spectral lines with high intensity will be superimposed on the continuum at certain specific wavelength positions, which are the identification spectrum of X-rays.
The logo spectrum has the following experimental rules.
(1) The identification spectrum of the anode material can be divided into several series, and each system has a certain excitation voltage. Only when the tube voltage exceeds the excitation voltage can the identification spectrum of the corresponding series of the material be produced. The greater the atomic number Z of the anode material, the higher the excitation voltage.
(2) Each identification line corresponds to a certain wavelength. When the tube voltage and tube current change, the wavelength does not change, only its intensity changes.
(3) Different anode materials have different wavelengths of the marking spectrum. The relationship between them is determined by Moseley's law, namely:
√(1/λ)=K(Z﹣σ)
In the formula, enter is the wavelength of the identification spectrum; K and 0 are both constants. That is, as the atomic number Z of the anode target material increases, the wavelength corresponding to the identification spectrum of the same system becomes shorter.
The wavelength difference between different lineage lines is quite large. The group with the shortest wavelength is called K line line. In the order of increasing wavelength, each line is called L line, M line, N line, etc., each line in each line A spectral line has a certain name. For example, the line with the longest wavelength in the K system is called Kα line. In the order of decreasing wavelength, the following lines are called Kβ, Kγ, etc. The Ka line is composed of two lines Kα1 and Kα2 with very small wavelength differences. The difference between their wavelengths Δλ=λKα2-λKα1 does not exceed 0.0004nm on average. Kα1 is the strongest line in the K series. It is about twice the intensity of Kα2, and Kα1 is about five times stronger than Kβ.
When an electron on any layer jumps to the K layer, it produces K-series X-rays; when it jumps to the L layer, it produces L-series X-rays, and so on. If electrons jump from an adjacent layer, the corresponding α X-rays will be generated. For example, KαX-rays will be generated when the electrons jump from the L layer to the K layer, and Lα X-rays will be generated when they jump from the M layer to the L layer. If the electrons jump from orbits separated by one layer, the corresponding BX-rays will be generated, for example, KβX-rays will be generated when jumping from the M layer to the K layer. If the electron jumps from two-layered orbits, the corresponding system of γ X-rays will be generated; for example, when the electrons jump from the N-layer to the K-layer, KγX-rays will be generated (Figure 4).
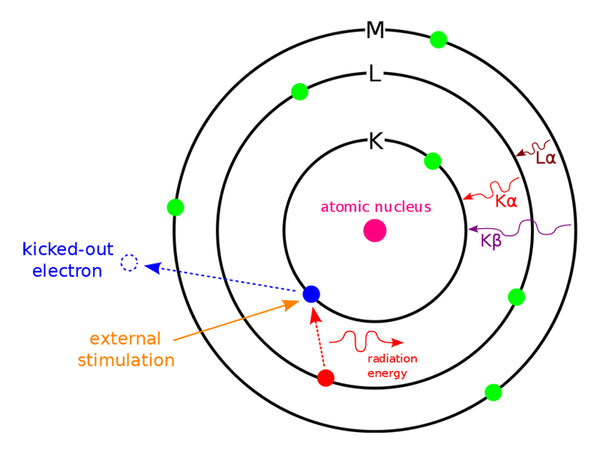
Figure 4 Schematic diagram of the production process of the marked X-ray spectrum
Since the energy difference between the electrons on the K layer and the M layer is larger than the energy difference between the electrons on the K layer and the L layer, the wavelength of the Kβ ray generated when the electron jumps from the M layer to the K layer is compared with the electron jump from the L layer to the K layer. The wavelength of the Kα rays generated at the time is short, but the Kα line is about five times stronger than the Kβ line. This is because the probability of electrons transitioning from the L layer to the K layer is about five times greater than the probability of transitioning from the M layer to the K layer. .
The energy of each electron belonging to the same layer is not exactly the same, but there is a very small difference, resulting in a double line phenomenon of the spectrum. For example, there are 8 electrons in the L layer, which belong to three sub-levels, and the electron energy of each sub-level is slightly different. Therefore, the wavelengths of the spectral lines generated when the electrons in the two sub-levels of the L layer jump to the K layer are also slightly different, so Kα rays can be divided into Kα1 and Kα2 double lines.
The correlation between the intensity of the X-ray and the tube voltage and tube current can be expressed as:
I standard=Ci(V﹣V0)m
In the formula, C is the constant of proportionality; i is the tube current intensity; V is the tube voltage; V0 is the X-ray excitation voltage of the anode material; the value of m is usually m=1.5 for K system and m=2 for L system .
Identification The ray spectrum and the continuum spectrum are superimposed, and the intensity of both is a function of the tube voltage and tube current. When using marking X-rays, people hope to find an appropriate working condition so that the marking harmonic line has the greatest intensity relative to the continuous spectrum. For K-series identification X-rays:
I standard/I connection=[Ci(V﹣VK)1.5/KiZV²]=C'×[(V/VK)﹣1]1.5/[ZV0.5K(V/VK)²]
In the formula, C’= C/K is a constant. Take I mark/I mark as the ordinate, V/Vk as the abscissa, it can be obtained by drawing method. When the tube voltage is 3 to 5 times higher than the excitation voltage, the intensity of the marking line relative to the continuous line is the largest. Therefore, when marking X-rays are used, the operating voltage of the X-ray tube is approximately 3 to 5 times the excitation voltage of the anode material. The suitable working voltage of commonly used X-ray tubes can be found in Figure 5.
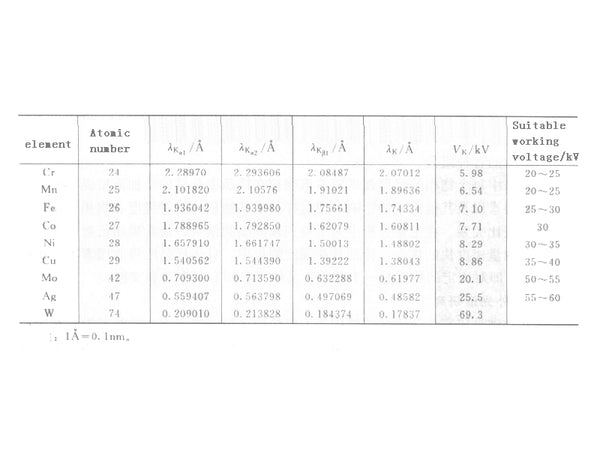
Figure 5 Related data of commonly used anode targets
In the crystal structure, the nucleus generally occupies a fixed position or only slightly vibrates, but the electrons outside the nucleus, especially the outer electrons, make extremely complex movements in the crystal space. You can study the distribution of electrons at each point in the crystal structure from a statistical point of view, or consider the probability of electrons appearing at each point in the crystal structure. Within a certain period of time, there are many electrons at a certain point in the crystal structure, that is, the probability of electrons appearing at this point is high, and the electron density at that point is high. The electron density at a certain point in the crystal structure is the probability density in the sense of time average.
The movement of electrons in the crystal structure is extremely complex, and the distribution of electron density in the crystal structure can reflect the arrangement of atoms. Related to atomic nuclei and electrons, the distribution law of the size of the electrostatic field in the crystal structure also reflects the arrangement of atoms.
When the X-ray beam irradiates the crystal structure and interacts with the electrons and electromagnetic fields in the crystal structure, some physical effects will occur in the crystal structure. Among them, the diffraction effect caused by X-ray scattering by electrons (coherent scattering) will reflect the distribution of electron density in the crystal structure space, and therefore also reflect the arrangement of atoms in the crystal structure, so the X-ray diffraction effect of the crystal can be used to Determine the atomic structure of the crystal.
Because X-rays are similar to visible light, the smooth surface of the crystal is similar to that of a mirror. Under the condition of ignoring the surface roughness of the crystal, Brag designed the X-ray reflection experiment on the crystal surface according to the specular reflection. The demonstration experiment uses CuKα radiation and rock salt (NaCl) crystals as gratings. When the crystal plane and the incident ray are at other angles, the intensity of the reflected line recorded is weak or even no reflection occurs. It can be seen that the reflection of X-rays on the crystal surface and the reflection of visible light on the mirror have something in common, that is, both satisfy the reflection law. X-rays can only be reflected when they are incident at certain specific angles. The conditions for the enhancement of the reflection lines of each crystal plane are:
2dsinθ=nλ
This formula is called the Bragg formula. In the formula, d represents the interplanar spacing; n is an arbitrary integer, called the coherence series; θ is the angle of incidence; λ is the X-ray wavelength.
Any crystalline substance has its characteristic diffraction peak position and intensity (Debye diagram phase). When the sample is an unknown multiphase mixture, each phase component will contribute its own unique set of lines (ie a set of d values) and relative strength on the synthesized Debye diagram. Therefore, if a series of d-values and relative strengths of a certain substance are all consistent with some of the lines on the Debye diagram obtained from the experiment, it can be preliminarily confirmed that the sample contains such a substance (or phase separation). After determining the substances or phases corresponding to the remaining lines on the obtained Debye diagram, the various components in the sample can be identified one by one.
The diffraction intensity of each phase in the sample increases as the amount of the phase in the sample increases, but due to the influence of sample absorption factors and other factors, the relationship between the diffraction intensity of a certain phase in the sample and the phase content It is not proportional. In order to obtain more accurate results in quantitative analysis, the diffractometer method is usually used. This method has the advantage of fast measurement speed, especially in intensity measurement, the absorption factor of a specific sample does not change with the diffraction angle 8, that is, it is a constant for a fixed substance. For details, please refer to relevant monographs and literature.